Kiali
개요
키알리는 서비스 메쉬 환경에서 발생하는 트래픽을 시각적으로 보여주는 툴이다.
문서 앞장에서부터 이스티오를 위한 콘솔이라고 대문짝으로 박아놔서, 내 문서 상으로도 그냥 이스티오에 때려박았다.
스스로 주권을 포기한 툴은 독립 디렉토리를 얻을 자격이 없다
사실 문서를 그다지 정리할 거리가 없다고 느꼈는데, 그냥 시작한 김에 정리..
아마 앞으로 키알리 문서를 다시 보게 된다면 FAQ 부분만 보게 되지 않으려나.[1]
기능
말 그대로 시각화를 하는 게 이놈 기능이다.
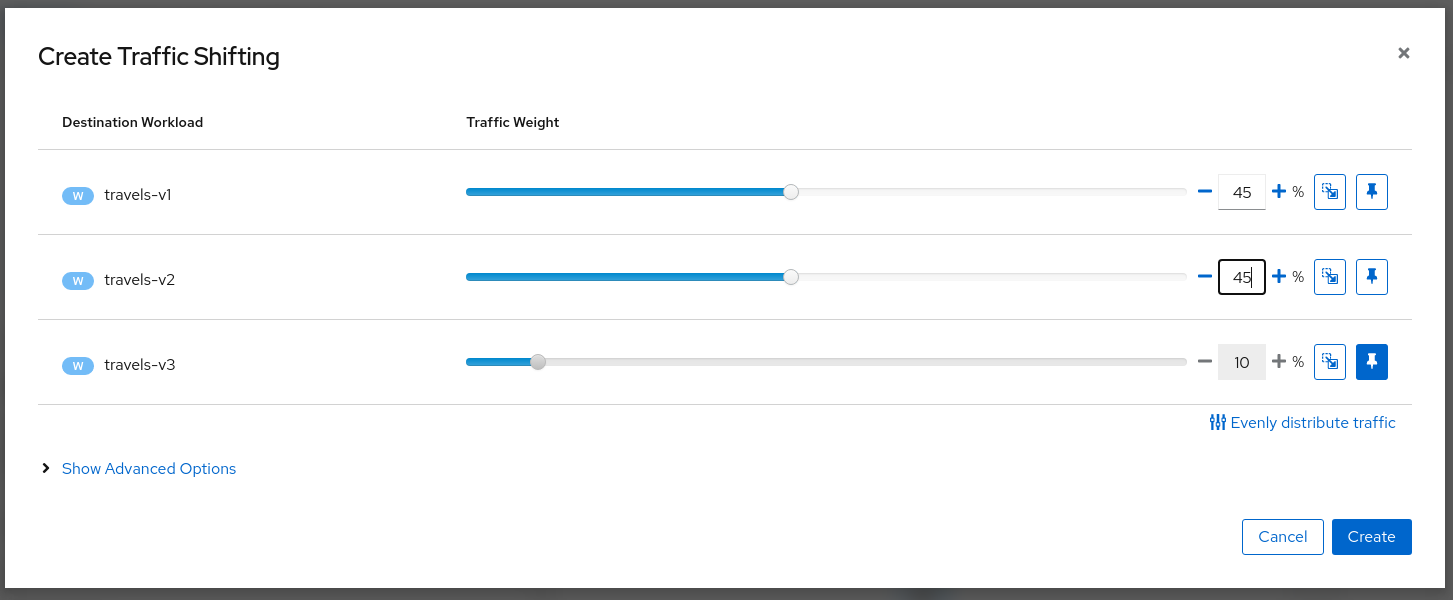
근데 아예 몇 가지 트래픽 관리 기능들을 콘솔에서 바로 수정할 수 있게도 지원해준다.[2]
시각적인 자료를 보면서 빠르게 수정을 하고 대응하는 것이 가능하다는 것.
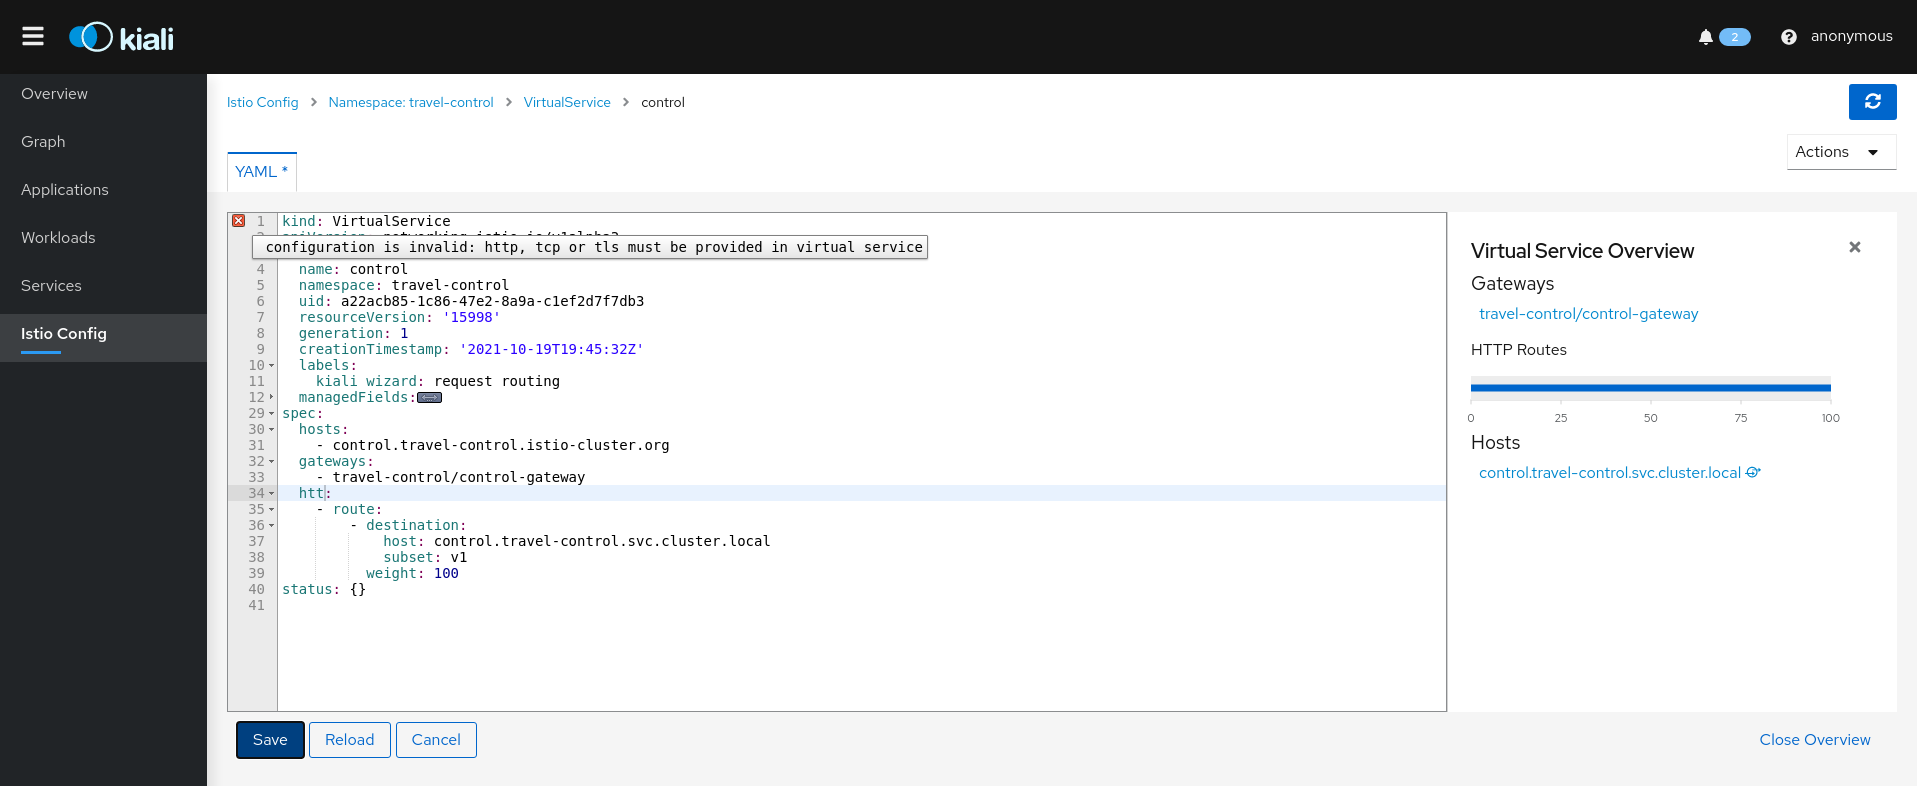
이스티오 전역 설정을 바로 손보거나 리소스를 만드는 것도 가능하다.[3]
아키텍처

키알리는 기본적으로 프로메테우스 메트릭을 읽어와 시각적으로 보여준다.
설치
가장 간단하게 설치하는 방법은 이스티오를 설치할 때 같이 딸려온 addon 디렉토리를 배포하는 것이다.
helm repo add kiali https://kiali.org/helm-charts
helm repo update
helm install \
    --set cr.create=true \
    --set cr.namespace=istio-system \
    --set cr.spec.auth.strategy="anonymous" \
    --namespace kiali-operator \
    --create-namespace \
    kiali-operator \
    kiali/kiali-operator
운영 환경에서 더 추천되는 방식은 키알리 오퍼레이터를 이용하는 것이다.
헬름을 이용하거나 operator hub를 이용하면 되는데, 그냥 키알리 서버를 설치하는 것도 가능은 하다.
그래도 기왕이면 키알리 커스텀 리소스를 통해 키알리를 관리하도록 권장하고 있다.
양식 작성법
뭐.. 그래도 커스텀 리소스가 있긴 하니까 해당 리소스 양식 작성법을 간단하게 다루겠다.
apiVersion: kiali.io/v1alpha1
kind: Kiali
metadata:
  name: kiali
  namespace: istio-system
spec:
  auth:
    strategy: "token"
  deployment:
    cluster_wide_access: false
    discovery_selectors:
      default:
      - matchLabels:
          kubernetes.io/metadata.name: bookinfo
    view_only_mode: false
  server:
    web_root: "/kiali"
보통 키알리는 이스티오 루트 네임스페이스(istio-system)에 배치하므로, 키알리 커스텀 리소스 역시 그곳에 배치해야 한다.
전체 양식은 여기에 나와있다(보기만 해도 짜증나게 작성된 문서)[4]
인증
spec:
  auth:
    strategy: anonymous
키알리 대시보드에 접속할 때 익명 유저 허용을 하는 것도 가능하지만, 인증을 통해서 접근하게 하는 것도 가능하다.
kubectl get secret -n istio-system $(kubectl get sa kiali-service-account -n istio-system -o jsonpath='{.secrets[0].name}') -o jsonpath='{.data.token}' | base64 -d
토큰 방식을 이용한다면 이 명령어로 토큰을 확인할 수 있다.
spec:
  auth:
    strategy: openid
    openid:
      client_id: "kiali-client"
      issuer_uri: "https://openid.issuer.com"
콘솔
  kiali_feature_flags:
    ui_defaults:
      metrics_inbound:
        aggregations:
        - display_name: Istio Network
          label: topology_istio_io_network
        - display_name: Istio Revision
          label: istio_io_rev
      metrics_outbound:
        aggregations:
        - display_name: Istio Revision
          label: istio_io_rev
이렇게 콘솔을 커스텀할 수 있다.
툴 연동
그라파나
spec:
  external_services:
    grafana:
      enabled: true
      # Grafana service name is "grafana" and is in the "telemetry" namespace.
      internal_url: 'http://grafana.telemetry:3000/'
      # Public facing URL of Grafana
      external_url: 'http://my-ingress-host/grafana'
      dashboards:
      - name: "Istio Service Dashboard"
        variables:
          namespace: "var-namespace"
          service: "var-service"
      - name: "Istio Workload Dashboard"
        variables:
          namespace: "var-namespace"
          workload: "var-workload"
      - name: "Istio Mesh Dashboard"
      - name: "Istio Control Plane Dashboard"
      - name: "Istio Performance Dashboard"
      - name: "Istio Wasm Extension Dashboard"
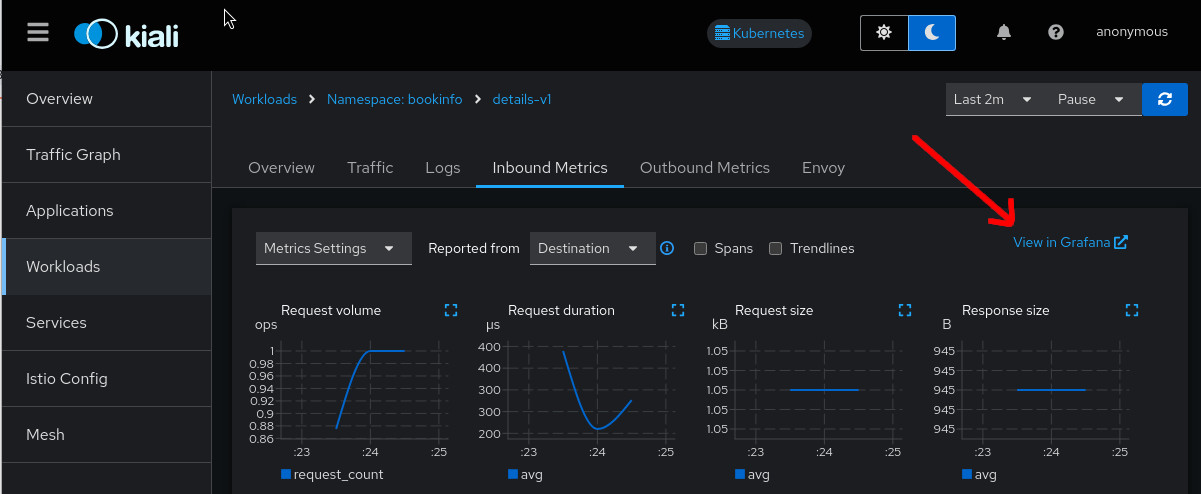
키알리에서 다른 툴로 바로 연동되게 하는 세팅이 가능하다.
이건 그라파나를 연동하는 예시.
프로메테우스
spec:
  external_services:
    prometheus:
      # Fix the "Unreachable" metrics server warning.
      health_check_url: "http://custom-tsdb-health-check-url"
      # Fix for the empty metrics dashboards
      thanos_proxy:
        enabled: true
        retention_period: "7d"
        scrape_interval: "30s"
프로메테우스와의 연동은 중요한데, 기본적으로 키알리가 프로메테우스 메트릭을 수집하기 때문이다.[6]
예거
spec:
  external_services:
    tracing:
      # Enabled by default. Kiali will anyway fallback to disabled if
      # Jaeger is unreachable.
      enabled: true
      # Jaeger service name is "tracing" and is in the "telemetry" namespace.
      # Make sure the URL you provide corresponds to the non-GRPC enabled endpoint
      # if you set "use_grpc" to false.
      internal_url: "http://tracing.telemetry:16685/jaeger"
      use_grpc: true
      # Public facing URL of Jaeger
      external_url: "http://my-jaeger-host/jaeger"
트레이싱으로는 Jaeger를 쓸 수 있는데, gRPC 통신을 하는 것이 가능하다.
커스텀 대시보드
custom_dashboards:
- name: vertx-custom
  title: Vert.x Metrics
  runtime: Vert.x
  discoverOn: "vertx_http_server_connections"
  items:
  - chart:
      name: "Server response time"
      unit: "seconds"
      spans: 6
      metrics:
      - metricName: "vertx_http_server_responseTime_seconds"
        displayName: "Server response time"
      dataType: "histogram"
      aggregations:
      - label: "path"
        displayName: "Path"
      - label: "method"
        displayName: "Method"
  - chart:
      name: "Server active connections"
      unit: ""
      spans: 6
      metricName: "vertx_http_server_connections"
      dataType: "raw"
  - include: "micrometer-1.1-jvm"
  externalLinks:
  - name: "My custom Grafana dashboard"
    type: "grafana"
    variables:
      app: var-app
      namespace: var-namespace
      version: var-version
대시보드 커스텀도 가능하다고 한다..[7]
관련 문서
| 이름 | noteType | created |
|---|